Corporate Performance Management
Key Performance Indicators Dashboard
The Executive Summary module boosts productivity with business intelligence tools such as our dashboard of Key Performance Indicators (KPI). Critical information concerning the company's business is conveniently summarized in real-time in one place: sales, inventory, receivables, payables, cash flow and financial statements. These powerful features enable management to quickly see their whole business picture, identify problem areas, track orders and sales, and provide a much greater degree of detail, if it is necessary. The Executive Summary is divided into four tabs: Current, Daily, Financial, and Ratio. Each one highlights key areas of the business.

Current Tab: Displays information concerning month-to-date and year-to-date sales, cost of goods sold, gross margin, gross margin percentage, receivables, open orders, shipments, payables and purchases. For some of the fields, there is a lookup button that provides users access to greater details. You can drill down all the way to individual invoices, payments, purchases, etc. Summary by Location, by Trader, by Direct Sales, and by Inventory Sales are also provided.
Daily Tab: Shows billing, sales, orders shipped, cash receipts, payments, purchases, and good received for the day. It also shows billings, gross margin, sales by day, month, quarter, and year with complete graphical capabilities (ie. charts and graphs). This feature allows management to identify key business trends.
Financial Tab: Displays financial statements for management to view the financial position of the company. There are options for detailed inquiry into each general ledger account.
Ratio Tab: Shows the key business ratios at a glance for management to monitor and measure the business performance and financial statistics.
Cashflow Forecasting
The Cash Flow Forecasting Worksheet in the Executive Summary module is an essential planning tool for monitoring, controlling, projecting, and reporting future cash income and requirements for the next few weeks or more. The extraction of information is based on any invoice due date that you specify.
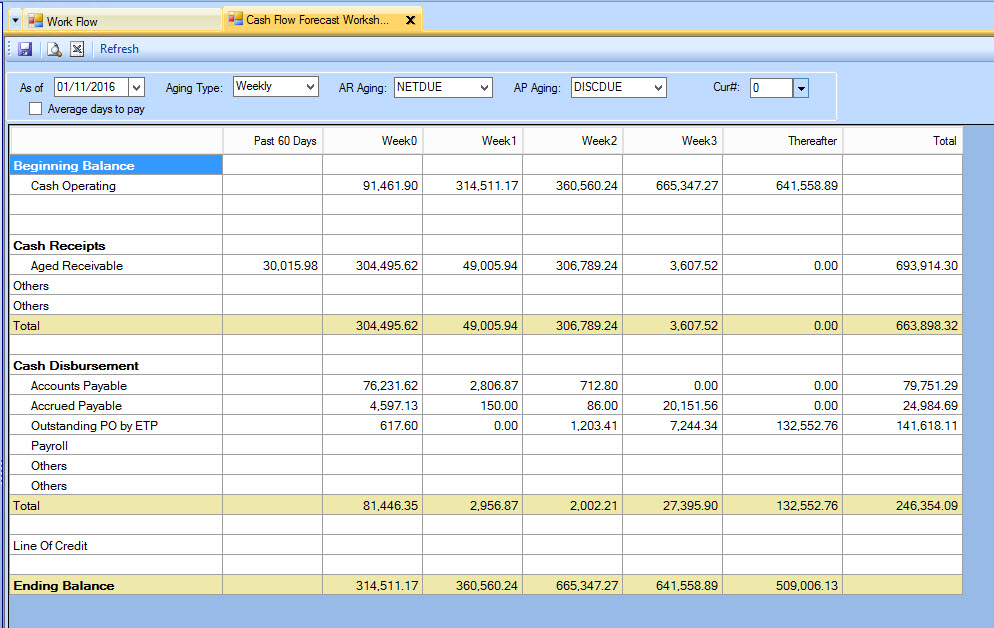
The worksheet uses figures from bank accounts, receivables, outstanding Sales by ETS (Estimated Time of Shipping), cash disbursements, payables, outstanding estimated time of payment, payroll, and line of credit. These figures can help you quickly determine how much cash is available or required. An average days to pay option is also available to provide a more realistic estimate. Detailed and summary reports can be displayed according to Aging Type, AR Aging and AP Aging.